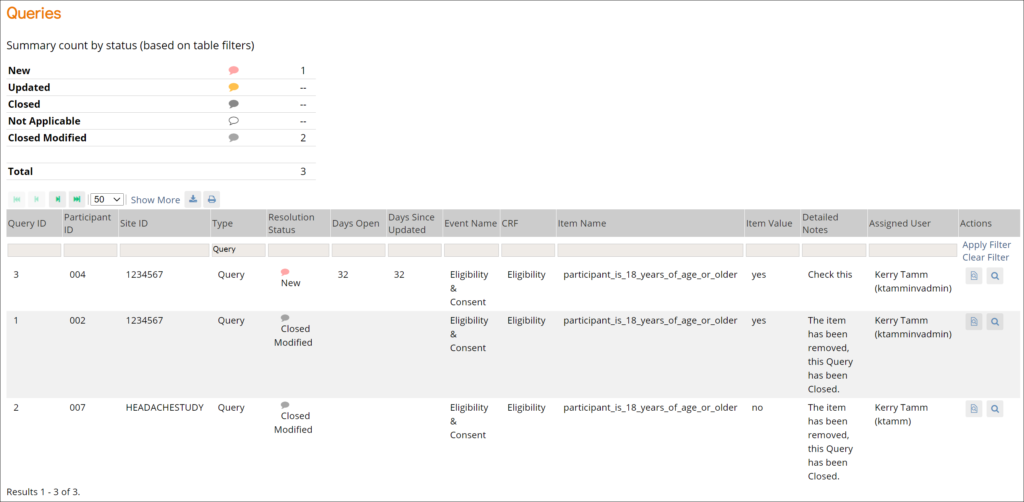
This screen displays all queries in the study environment. On this screen, you can view, add, update, and close queries, depending on access. Queries are usually added while reviewing forms from the Participant Details screen, but you can also add them when reviewing forms here.
For information about working with queries and available query actions, see Queries (Monitor) or Queries (Data Manager). This article describes the status icons displayed in the Queries panel.
Query and Annotation Status Icons
The following table describes the icons and statuses that appear in the Queries panel.
| Icon | Status | Description |
 | No Query | Click this bubble to create a new query. |
 | New | A query has been added by a user with Review access to the form (ex. Monitor or a Data Manager) or was automatically generated by OpenClinica based on built-in edit checks. |
 | Updated | A user with Review access to the form has added information to the query. |
 | Closed | The query is considered resolved by the Data Manager or Monitor. |
 | Closed Modified | A slightly lighter version of the Closed icon indicates that data was changed after the query was closed. |
 | Multiple New Queries | Indicates that multiple new queries exist. You can select each query from the sidebar. |
 | Multiple Updated Queries | Indicates that multiple updated queries exist. You can select each query from the sidebar. |
 | One or Multiple Annotations | Indicates that one or more annotations exist. You can select each annotation from the sidebar. |
ℹ️ Note: System-generated queries appear in the Queries table with System listed as the user.
Was this article helpful?
That’s Great!
Thank you for your feedback
Sorry! We couldn't be helpful
Thank you for your feedback
Feedback sent
We appreciate your effort and will try to fix the article